
ETNA RADIO OBSERVATORY
Live data from PENNISI (CT), Sicily
Maintained by Rosario Catania - Alessandro Longo - Flavio Falcinelli

(To see on google map click this link https://goo.gl/maps/kvwoGeqBpQEdrpkTA ( 37.6471543,15.1118346)
The Pennisi station is located on the slopes of the Etna, the highest active volcano in Europe. It's equipped with a microwave receiver supplied by the company RadioAstroLab S.r.l of Senigallia, Ancona, Italy, which granted a RAL10TS receiver, an LNB RAL10 illuminator, and the ARIES graphic recording and processing software on loan for use. (Thanks to Flavio Falcinelli for the supply). The microwave system is heated and equipped with an offset dish for the reception of 100 cm satellite TV.
It is interesting to check if the RAL10TS microwave radiometer produced by RadioAstroLab s.r.l (operating at 11.2 GHz), connected to the external unit RAL10_LNB positioned on the fire a satellite TV antenna, can be used for detect volcanic eruptions. The purpose is to measure, with reasonable degree of reliability and repeatability, the increase in thermal emission due to hot eruptive spots that occur on the volcanic wall compared to the "resting" scenario observed by the tool. The analysis is supported by a simulation that models the measurement system using the radiometer response curves measured in the laboratory. Hopefully, despite the inevitable simplifications adopted, to frame the problem by identifying the factors that influence the measure: the results obtained could be a useful starting point to plan the field experimentation. The remote monitoring system assumed for this project is passive in nature: using a microwave radiometer the natural electromagnetic radiation of bodies (such as soil and atmosphere) emitted due to temperature and energy interactions between the atoms and the molecules that constitute them is received. The instrument observes the scenario, monitoring some significant parameters in order to understand how to change its state over time and according to environmental conditions. The thermal emission coming from the ground, for example, depends on the product of the its physical temperature for the emissivity, a parameter that describes the efficiency of the object to irradiate, function of the chemical-physical characteristics of the material and of the direction of observation. In the microwave band (between millimeter and decimeter wavelengths), instead to the infrared band, the differences are due to the changes in emissivity of the observed region, secondarily of temperature. A very important advantage in use of a microwave radiometer for the study of the environment is that, if well designed and built, it can work automatically for long periods of time, (almost) in each weather condition and regardless of solar lighting, without requiring the presence of operators
System 1: MICROWAVE RECEIVER
Summary of the installation of the microwave receiver at Pennisi's ERO station.
The kit includes a:
- 100cm offset dish with RAL10 , LNB and RadioCielo project RAL10TS receiver
- ARIES acquisition software of RadioAstroLab version 3.0
The target is Etna and sky portion at a distance of 14km, with an elevation angle on the horizontal plane of the installation site of 10.2 °. This system has been installed and start-up 06.03.2019 at 09.00 UTC. Is protected with UPS, with temperature control of the receiver (40 ° C) and the LNB (47 ° C).A PC processing and networking equipped with Intel Pentium CPU G620 @ 2.60GHz, 4GB ram, and windows 10 64bit.

ERO PENNISI view - credits: www.etna-ero.it

ERO microwave receiver, field of view - credits: www.etna-ero.it

ERO RAL10 LNB - credits: www.etna-ero.it

Microwave radiometer RAL10TS - credits: www..radioastrolab.it

Brightness profile of the volcanic wall - credits: www..etna-ero.it

Variation of the eruptive spot (red line) - credits: www..etna-ero.it

General scheme of the microwave receiver - credits: www..radioastrolab.it

Block diagram of the microwave receiver- credits: www.radiostrolab.it
System 2: Self-built microwave receiver with serial datalogging
Radio telescopes observe the sky for radiation at wavelengths that are thousands or millions of times longer than visible light. Radio waves have a much longer wavelength than visible light, which is why professional radio telescopes are huge. The basic technology behind radio telescopes is quite simple and with some cheap equipment and simple tools, it is quite easy to build a simple but functional one.
The sun and other objects radiate not only visible light but also radio waves. With this simple radio telescope it is possible to do didactic activities such as studying the transits of the Sun and Moon, or find the same stars on a cloudy day, demonstrate that the surface of the Earth emits radio waves and locate artificial satellites. In our case we use the radio telescope to measure the temperature of the vertical scenario above our head (zenith), displaying the differences in the signal received during the seasons or perturbations
ERO microwave receiver - credits: www.etna-ero.it
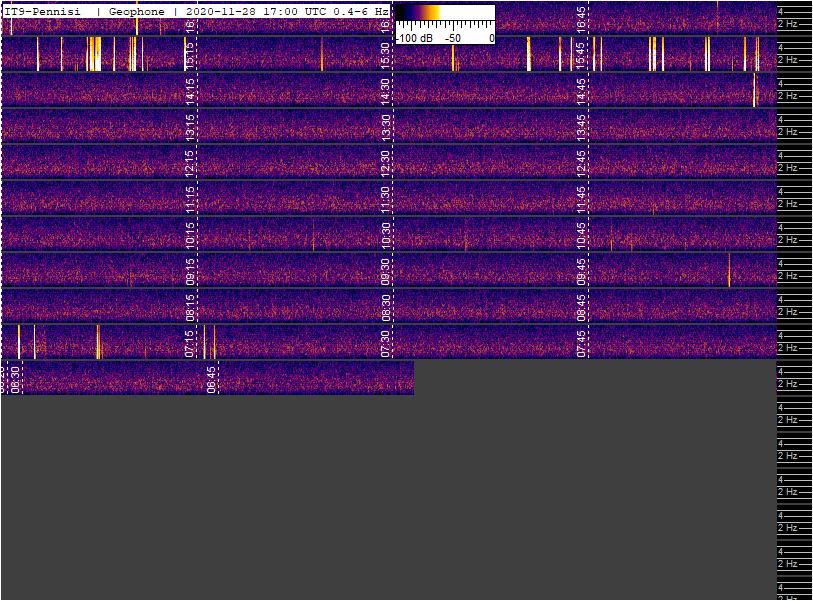
System 3: GEOPHONE
Geophone Multistrip hourly representation, useful for local seismic and vulcanic events correlation.
Scroll time 4.6 sec, updated every hour.

.jpg)
.jpg)
ERO last GEOPHONE multi strips- credits: www.etna-ero.it
ERO vertical geophone - credits: www.etna-ero.it
System 4: Ultrasonic sensor with datalogger
ARDUBAT (http://home.earthlink.net/~bat-detector/ArduBat/) is a project developed for multiple purposes. It could be used to develop a bat alarm or a video camera that is activated when bats are nearby. Or you can use it to record the date and time the bats are active. But in ERO, we use it both for monitoring bats but in general for receiving and decoding ultrasonic signals. The stack created by ERO uses the ARDUBAT circuit, a card for datalogging on SD memory, and an ARDUINO UNO R3 prototype card. The system acquires ultrasound at the bats' emission frequencies, records on SD card and transmits data via serial port to be available online at any time.
ERO Ultrasonic sensor with datalogger - credits: www.etna-ero.it